Using Cross-validation in Scala with H2O and getting each cross-validated model

Here is Scala code for binomial classification with GLM:

https://aichamp.wordpress.com/2017/04/23/binomial-classification-example-in-scala-and-gbm-with-h2o/

To add cross validation you can do the following:

def buildGLMModel(train: Frame, valid: Frame, response: String)
 (implicit h2oContext: H2OContext): GLMModel = {
 import _root_.hex.glm.GLMModel.GLMParameters.Family
 import _root_.hex.glm.GLM
 import _root_.hex.glm.GLMModel.GLMParameters
 val glmParams = new GLMParameters(Family.binomial)
 glmParams._train = train
 glmParams._valid = valid
 glmParams._nfolds = 3  ###### Here is cross-validation ###
 glmParams._response_column = response
 glmParams._alpha = Array[Double](0.5)
 val glm = new GLM(glmParams, Key.make("glmModel.hex"))
 glm.trainModel().get()
}

To look cross-validated model try this:

scala> glmModel._output._cross_validation_models
res12: Array[water.Key[_ <: water.Keyed[_ <: AnyRef]]] = 
    Array(glmModel.hex_cv_1, glmModel.hex_cv_2, glmModel.hex_cv_3)

Now to get each model do the following:

scala> val m1 = DKV.getGet("glmModel.hex_cv_1").asInstanceOf[GLMModel]

And you will see the following:

scala> val m1 = DKV.getGet("glmModel.hex_cv_1").asInstanceOf[GLMModel]
m1: hex.glm.GLMModel =
Model Metrics Type: BinomialGLM
 Description: N/A
 model id: glmModel.hex_cv_1
 frame id: glmModel.hex_cv_1_train
 MSE: 0.14714406
 RMSE: 0.38359362
 AUC: 0.7167627
 logloss: 0.4703465
 mean_per_class_error: 0.31526923
 default threshold: 0.27434438467025757
 CM: Confusion Matrix (vertical: actual; across: predicted):
 0 1 Error Rate
 0 10704 1651 0.1336 1,651 / 12,355
 1 1768 1790 0.4969 1,768 / 3,558
Totals 12472 3441 0.2149 3,419 / 15,913
Gains/Lift Table (Avg response rate: 22.36 %):
 Group Cumulative Data Fraction Lower Threshold Lift Cumulative Lift Response Rate Cumulative Response Rate Capture Rate Cumulative Capture Rate Gain Cumulative Gain
 1 0.01005467 0....
scala> val m2 = DKV.getGet("glmModel.hex_cv_2").asInstanceOf[GLMModel]
m2: hex.glm.GLMModel =
Model Metrics Type: BinomialGLM
 Description: N/A
 model id: glmModel.hex_cv_2
 frame id: glmModel.hex_cv_2_train
 MSE: 0.14598908
 RMSE: 0.38208517
 AUC: 0.7231473
 logloss: 0.46717605
 mean_per_class_error: 0.31456697
 default threshold: 0.29637953639030457
 CM: Confusion Matrix (vertical: actual; across: predicted):
 0 1 Error Rate
 0 11038 1395 0.1122 1,395 / 12,433
 1 1847 1726 0.5169 1,847 / 3,573
Totals 12885 3121 0.2025 3,242 / 16,006
Gains/Lift Table (Avg response rate: 22.32 %):
 Group Cumulative Data Fraction Lower Threshold Lift Cumulative Lift Response Rate Cumulative Response Rate Capture Rate Cumulative Capture Rate Gain Cumulative Gain
 1 0.01005873 0...
scala> val m3 = DKV.getGet("glmModel.hex_cv_3").asInstanceOf[GLMModel]
m3: hex.glm.GLMModel =
Model Metrics Type: BinomialGLM
 Description: N/A
 model id: glmModel.hex_cv_3
 frame id: glmModel.hex_cv_3_train
 MSE: 0.14626761
 RMSE: 0.38244948
 AUC: 0.7239823
 logloss: 0.46873763
 mean_per_class_error: 0.31437498
 default threshold: 0.28522220253944397
 CM: Confusion Matrix (vertical: actual; across: predicted):
 0 1 Error Rate
 0 10982 1490 0.1195 1,490 / 12,472
 1 1838 1771 0.5093 1,838 / 3,609
Totals 12820 3261 0.2070 3,328 / 16,081
Gains/Lift Table (Avg response rate: 22.44 %):
 Group Cumulative Data Fraction Lower Threshold Lift Cumulative Lift Response Rate Cumulative Response Rate Capture Rate Cumulative Capture Rate Gain Cumulative Gain
 1 0.01001182 0...
scala>

Thats it, enjoy!!


Plotting scoring history from H2O model in python

Once you build a model with H2O the scoring history can be see in the mode details or model metrics table. If validation is enabled then scoring and validation history is also visible. You can see these metrics in the FLOW UI however if you are using python shell then you may want to plot training and/or validation metrics by your self and this is what we will do next.

To get the scoring history from the model in python you can just try the following:

import pandas as pd
sh = mymodel.score_history()
sh = pd.DataFrame(sh)
print(sh.columns)


The results are as below:

Index([u'', u'timestamp', u'duration', u'number_of_trees', u'training_rmse',
       u'training_logloss', u'training_auc', u'training_lift',
       u'training_classification_error'],
      dtype='object')

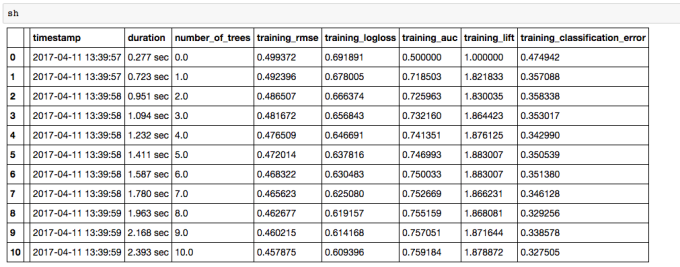
The model’s scoring history table looks like as below:

Screen Shot 2017-04-11 at 3.43.14 PM

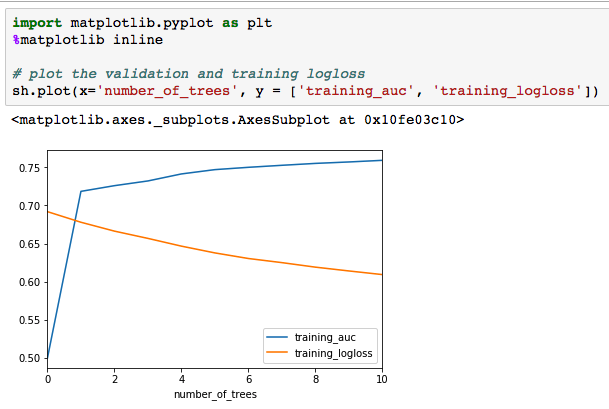
Next we can plot a graph between training_logloss and training_auc as below:

import matplotlib.pyplot as plt
%matplotlib inline 
# plot training logloss and auc
sh.plot(x='number_of_trees', y = ['training_auc', 'training_logloss'])

The results are as below:

Screen Shot 2017-04-11 at 3.44.32 PM

Thats is, enjoy!!


Managing timestamps values with n-fold cross validation

When using cross validation with n-folds user can choose a specific column as fold columns. More details on fold columns are described below:

http://docs.h2o.ai/h2o/latest-stable/h2o-docs/data-science/algo-params/fold_column.html

Using fold columns the various splits will be created into custom grouping based on numerical or categorical values into the fold column.

This is how fold column setting is used in H2O:

Screen Shot 2017-04-11 at 9.34.14 AM


Question: Is it wise to use time stamp values based column as fold column?

Answer: It is not advised to directly feed the timestamp values based column to the fold_column argument and it would be a wrong decision. The main reason is that there are too many unique values in this scenarios which will cause problems.

The best way to handle such scenario is to first form a new column that is based on year/month/day for the given timestamp values  and then feed this newly create column as fold column to your Cross Validation process. 

Thats it, enjoy!!

Cross-validation example with time-series data in R and H2O

What is Cross-validation: In k-fold crossvalidation, the original sample is randomly partitioned into k equal sized subsamples. Of the k subsamples, a single subsample is retained as the validation data for testing the model, and the remaining k − 1 subsamples are used as training data. learn more at wiki..

When you have time-series data splitting data randomly from random rows does not work because the time part of your data will be mangled so doing cross-validation with time series dataset is done differently.

The following R code script show how it is split first and the passed as validation frame into different algorithms in H2O.

library(h2o)

h2o.init(strict_version_check = FALSE)

# show general information on the airquality dataset

colnames(airquality)

dim(airquality)

print(paste(‘number of months:’,length(unique(airquality$Month)), sep=“”))

# add a year column, so you can create a month, day, year date stamp

airquality$Year <- rep(2017,nrow(airquality))

airquality$Date <- as.Date(with(airquality, paste(Year, Month, Day,sep=“-“)), “%Y-%m-%d”)

# sort the dataset

airquality <- airquality[order(as.Date(airquality$Date, format=“%m/%d/%Y”)),]

# convert the dataset to unix time before converting to an H2OFrame

airquality$Date <- as.numeric(as.POSIXct(airquality$Date, origin=“1970-01-01”, tz = “GMT”))

# convert to an h2o dataframe

air_h2o <- as.h2o(airquality)

# specify the features and the target column

target <- ‘Ozone’

features <- c(“Solar.R”, “Wind”, “Temp”,  “Month”, “Day”, “Date”)

# split dataset in ~half which if you round up is 77 rows (train on the first half of the dataset)

train_1 <- air_h2o[1:ceiling(dim(air_h2o)[1]/2),]

# calculate 14 days in unix time: one day is 86400 seconds in unix time (aka posix time, epoch time)

# use this variable to iterate forward 12 days

add_14_days <- 86400*14

# initialize a counter for the while loop so you can keep track of which fold corresponds to which rmse

counter <- 0

# iterate over the process of testing on the next two weeks

# combine the train_1 and test_1 datasets after each loop

while (dim(train_1)[1] < dim(air_h2o)[1]){

    # get new dataset two weeks out

    # take the last date in Date column and add 14 days to i

    new_end_date <- train_1[nrow(train_1),]$Date + add_14_days

    last_current_date <- train_1[nrow(train_1),]$Date


    # slice with a boolean mask

    mask <- air_h2o[,“Date”] > last_current_date

    temp_df <- air_h2o[mask,]

    mask_2 <- air_h2o[,“Date”] < new_end_date


    # multiply the mask dataframes to get the intersection

    final_mask <- mask*mask_2

    test_1 <- air_h2o[final_mask,]


    # build a basic gbm using the default parameters

    gbm_model <- h2o.gbm(x = features, y = target, training_frame = train_1, validation_frame = test_1, seed = 1234)


    # print the number of rows used for the test_1 dataset

    print(paste(‘number of rows used in test set: ‘, dim(test_1)[1], sep=” “))

    print(paste(‘number of rows used in train set: ‘, dim(train_1)[1], sep=” “))

    # print the validation metrics

    rmse_valid <- h2o.rmse(gbm_model, valid=T)

    print(paste(‘your new rmse value on the validation set is: ‘, rmse_valid,‘ for fold #: ‘, counter, sep=“”))


    # create new training frame

    train_1 <- h2o.rbind(train_1,test_1)

    print(paste(‘shape of new training dataset: ‘,dim(train_1)[1],sep=” “))

    counter <<- counter + 1

}

Thats all, enjoy!!